Climate change is a relatively simple concept. Over the course of the planet’s history, the Earth’s temperature has risen and fallen many times. In the distant past, temperature extremes reflected geological changes of great magnitude, but in relatively recent times, the changes have been more moderate. In examining these charts it is important to recall that these are not actual measurements until we get into modern periods when we actually used thermometers and CO2 direct measurements. The charts of ancient times are based on indirect measurements of temperature, dust, and CO2. So while these are good indications, they are necessarily relatively approximate estimates of the real data at the time. For example in the past 500,000 years (relatively recent times), the temperature has ranged from about 8.5C colder than now to about 3C warmer than now. During that time there were four “ice ages” and five “warm” periods, the last warm period is the one we are in just now. During warm periods CO2 was high, about 250 to 280 parts per million (ppm). During the cold periods the CO2 concentration was about 150 to 220 ppm. At the same time dust in the air was up during cold periods, and down during warm periods.
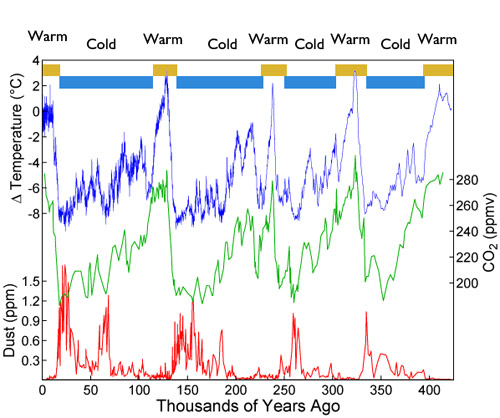 This original graph is courtesy of Vostok-ice-core-petit.png: NOAA, and is a derivative work: Autopilot, to which I added the warm cold text and graphic. The original data sets are available from: Noaa set #1, Noaa set #2, and Noaa set #3
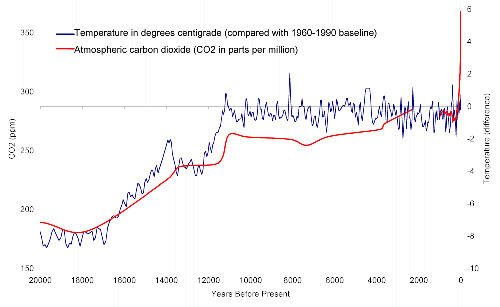
The last warm period has been with us for only a very short period of time (relatively speaking). At the end of the last ice age, the temperature was about 8C or 9C lower on average than it is today. At the same time CO2 level was at about 180ppm. After the coldest period, temperature and CO2 appear to rise more-or-less together. As CO2 rose to 260ppm, the temperature of the Earth rose as well to about the same temperature as it is today, and has remained more or less steady for the last 10,000 to 12,000 years. Perhaps not coincidentally, this was the same period when humans made use of the now steady and warm conditions to become agricultural and to leave behind the nomadic hunter-gatherer lifestyle. The consistent climate of about the same temperature has been with us with variations up and down, spiking to 3C above present temperature to spikes as low as 2C below our current temperature. Each of these spikes lasted between 100 and 1,000 years. Using indirect measures, the CO2 has been relatively constant until recent historical times. The industrial age began in the 1700s and was a major activity by 1850. Since then CO2 has been rising very steadily from about 280ppm to nearly 400ppm today, much higher than it has been for the past 800,000 years. From indirect evidence it appears that CO2 has been a great deal higher in the far distant past, but in the last half million years it has remained between about 150ppm and 300ppm.
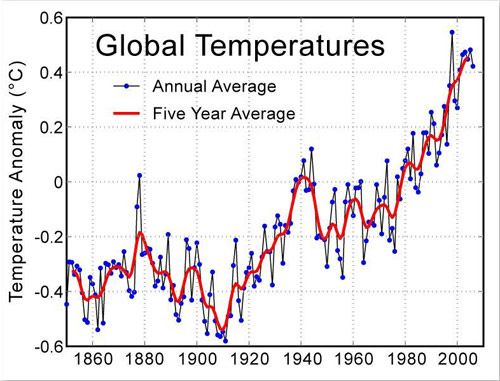
 Temperature began a steady rise beginning about 1910. The temperature records are very good for these recent periods because they are direct measurements made in numerous places over the earth. Over that period of time measurements taken over the land and the ocean suggest that there has been an upward trend that averages out to a little more than a degree Celsius increase in average temperature.
 In very recent years, from 1970 to the present, the rise in temperature has been pretty steady, but still showing considerable variation.
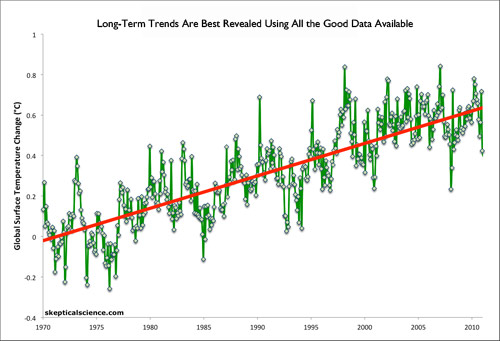 Land and ocean data from NOAA NCDC showing the 42-year warming trend (Jan ’70 to Dec ’11; red).
Often people are tempted to think about the weather (rather than the climate) and to recall what has happened in the last 10 or 15 years. Because weather has so much variation from year to year, it is difficult to see climate trends accurately when you only look back 10 to 15 years. It is always best to use all the good data that you have over the longest period possible. This next graph illustrates the risk of using only a few years to judge long-term temperature trends. The blue lines depict some 10 year trends that really don’t look much like global warming until you look at the entire graph.
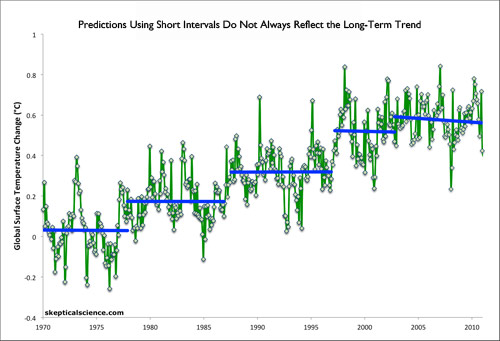 Land and ocean data from NOAA NCDC. The short-term cooling trends shown are from Jan ’70 to Nov ’77, Nov ’77 to Nov ’86, Sep ’87 to Nov ’96, Mar ’97 to Oct ’02, and Oct ’02 to Dec ’11 (blue).
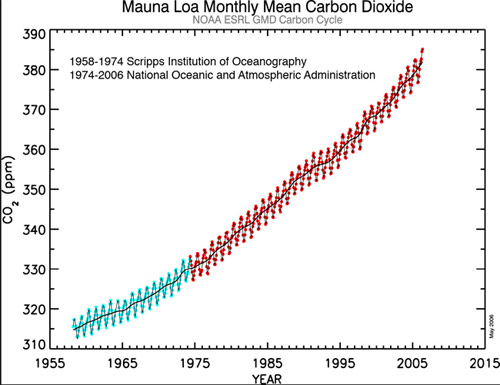
Very accurate records of CO2 are available from the observatory at Mauna Loa in Hawaii since about 1955. They show a consistent rise in CO2 in that period from about 310ppm to nearly 400ppm. This is a smooth curve, whereas the weather shows marked variation, so temperature fluctuation in the short term is influenced by more than just CO2. Overall, however, the relationship is a pretty good fit.
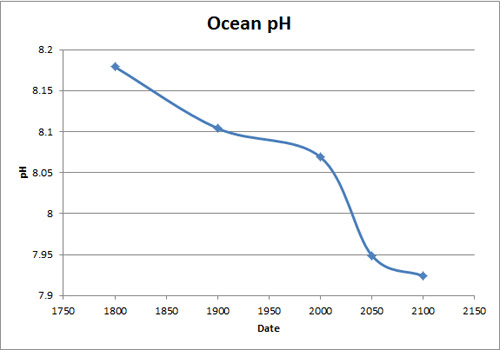
The ocean is the main carbon sink in the CO2 cycle. The ocean absorbs an enormous amount of CO2. As it absorbs CO2, the ocean becomes more acidic. The optimum ocean pH for the calcium carbonate based organisms like shrimps, crabs, corals, clams, mussels etc, is about pH8.2. Much below that level and their survival rates diminish. Since pre-industrial times, the ocean pH has dropped from 8.20 to about 8.05. It is predicted that by 2081, the pH will be down to about 7.97. This represents about 100% more hydrogen ions than in pre-industrial times. Various predictions have been made about these animals. All such predictions are useful to test the hypothesis.
In one of the most definitive early papers on climate change, James Hansen (Science 28 August 1981, Volume 213, Number 4511) described his view of how history would play out during the 100 years to follow (from 1981 to 2081). Here is what he said:
Political and economic forces affecting energy use and fuel choice make it unlikely that the CO2 issue will have a major impact on energy policies until convincing observations of the global warming are in hand. In light of historical evidence that it takes several decades to complete a major change in fuel use, this makes large climate change almost inevitable. However, the degree of warming will depend strongly on the energy growth rate and choice of fuels for the next century.
Thus, CO2 effects on climate may make full exploitation of coal resources undesirable. An appropriate strategy may be to encourage energy conservation and develop alternative energy sources, while using fossil fuels as necessary during the next few decades.
The climate change induced by anthropogenic release of CO2 is likely to be the most fascinating global geophysical experiment that man will ever conduct. The scientific task is to help determine the nature of future climatic effects as early as possible. The required efforts in global observations and climate analysis are challenging, but the benefits from improved understanding of climate will surely warrant the work invested.
We have travelled about 1/3rd of the way along James Hansen’s century prediction. Already the interplay of political, scientific, and environmental forces that he predicted is beginning to unfold. If he was also correct that it will take the full century to see enough change due to global warming to make a big impact on energy policies, then that shift from fossil fuels to something else will only really take hold after another 70 years.
There are many predictions for what will occur by 2081. There are those that suggest nothing much will have changed. However, they do not present different evidence to support that contention. They use the same data, but interpret it differently. This is also an hypothesis — a prediction of no global warming. Still others suggest that science is a hoax. Being a scientist myself, I must say I find that unlikely, especially as it seems only to be climate change scientists who are in on the hoax. In some cases, the scientists or advocates have other agendas and are funded by industries that might suffer if global warming were accepted by politicians as a real and present threat. The important fall-out of these no change predictions is to decide not to take any action at the present time to adapt or mitigate climate change. If the people who argue that global warming is not occurring are correct, by 2081 their prediction will have played out and all will be well.
Then there is everybody else. The rest agree that global warming is occurring, but disagree on whether it is due to anthropogenic activities. If James Hansen is correct about human nature as well as about global warming, it won’t really matter what people believe until the changes are so obvious, and presumably so expensive, that they will be forced to pay attention to the facts.
What will the world be like if global warming does occur? The most important factor in making that type of prediction is “how much warming” will occur. The most widely accepted changes likely to occur by 2081 are as follows:
1) Temperature rise to 3C above 2000 levels on average (higher at poles)
2) Sea level rise to 1.4m above 2000 levels
3) CO2 levels rise to 500ppm
4) Ocean pH falls from 8.2 to 7.9 (Hydrogen ion levels 100% higher than 2000).
There are other direct effects that are currently predicted but the scientific hypotheses are clearly set out above and will easily be tested and modified as time proceeds. And as is usual in science, increased data improves the predictions. So this is a falsifiable hypothesis (basic science) with a number of inherently easy tests to carry out (see if the above estimates match reality).
The next part of what may be the world’s greatest “experiment” in terraforming is to suggest to the politicians and the public what the consequences of the grand experiment might be, if in fact the hypothesis of anthropogenic global warming turns out to be correct.
1) a. There will no longer be permanent ice in the Arctic Ocean and the North West passage will be open to navigation.
b. Desertification will intensify in sub-Saharan Africa and begin in mid-USA as well as many other areas.
c. Deaths from extreme heat in tropical areas will increase.
d. Distribution of many species including pests and disease organism will move northward and southward away from the equator.
e. Former agricultural areas will decline and new agricultural areas will need to be opened.
2) a. By 2081, a sea level rise of 1.4m will be enough to seriously damage a huge amount of global infrastructure and force inward migration of millions of people in anticipation of continued rises in the sea level, or alternatively massive efforts to build some form of retaining walls to protect major investments in coastal infrastructure.
b. Several island nations will have been evacuated.
c. Thousands of people will refuse to move or will not be able to afford to move and will die in storm surges.
d. Fresh water supplies will be severely damaged in many coastal areas from sea water contamination
e. Infrastructure protection costs will become quite high and insurance will not be available for coastal regions.
3) a. CO2 has an inertial effect because it takes a long time to remove it from the atmosphere, thus the effects will last over 1,000 years.
b. Methane gas will be added to the greenhouse gas effect as the permanent land ice melts in the north releasing the trapped animals and plants to decompose. This methane will accelerate the temperature rise.
4) a. Ocean acidification will reduce survival rates of many organisms that have calcium carbonate exoskeletons.
b. Ocean fisheries will decline as prey organisms decline.
c. Coral reef structures will decline causing coral island erosion making it more difficult to adapt to the sea level rise.
There are lots more potential consequences to consider, but that is enough to illustrate the gravity of the consequences if the predicted global warming continues as the hypothesis suggests it will. Because of the potentially grave effects on the world, politicians, and presumably everyone who thinks this might happen are trying to figure out what to do. Fossil fuels are both the single most important source of energy for the economy and the single most important source of CO2 and other greenhouse gasses being added in a “non-natural” fashion to the atmosphere. So the world is dependent on fossil fuels just now.
Calculations of the cost to adapt to the levels of change predicted above are seen by politicians as relatively trivial compared to the cost of having to give up fossil fuels at this time. Most estimates of costs to adapt to changes even up to 2100 are in the range of 1% of GDP. To manage world budgets to a 1% level is difficult in any case, so the basic governmental assumption is to just accept the small extra cost and see what happens.
There is one final prediction that is difficult to test within a time frame that would allow humankind to do much about it before it is “too late.” This is the concept of tipping point. In this concept, a process gathers speed and strength until it reaches the point where it is in a runaway condition and will not on its own reverse itself until the entire course of events is played out. Applied to global warming, it suggests that at some point the CO2 will be sufficient that it triggers many other actions to release more greenhouse gasses (from the ocean and from the permafrost) that will force temperature to rise to some undefined maximum. It is not well-established when that tipping point would be reached. In the geological past, the most recent time when all the ice melted was about 3 million years ago, long before humans existed, but certainly when lots of other animals and plants existed.
So while life can certainly exist on earth at much higher temperatures and with much less land area as the sea levels rise, it is anyone’s guess whether people will actually be able to survive. We have never had to endure temperatures more than about 3C on average warmer than at present. And we have certainly never faced super crowded conditions with 9+ billion people depending on a reduced agricultural area to feed 50% more people than we currently have.
In summary, we have known about the effects of greenhouse gasses for more than a century and have had solid scientific predictions for 30 years. Nonetheless, because there are few really obvious signs yet except in the North where ice melt is really obvious, but where too few people live to easily have an affect on global opinion. Ice melting int he far north is a “remote” effect for most people.
Given that there is very little currently affecting everyone, we collectively hesitate to spend huge amounts of money and to compromise current economic well-being on the chance that a disaster may be around the corner, not for us, but for our grandchildren and great-grandchildren.
As a scientist, I tend to follow evidence-based logic, so my opinions as a human being are pulled to the scientific predictions. I also am a realist, however, and know that most people don’t react until it hurts not to react. So my professional reaction is to attempt to place the evidence where any one can see it in relatively simple terms. My personal reaction is to understand human behaviour and to make adaptive preparations that I think will give my grandchildren and great-grandchildren some slight advantage in the coming century.

Hello and thank you for this article. So-called environmentally induced migration is multi-level problem. According to Essam El-Hinnawi definition form 1985 environmental refugees as those people who have been forced to leave their traditional habitat, temporarily or permanently, because of a marked environmental disruption (natural or triggered by people) that jeopardised their existence and/or seriously affected the quality of their life. The fundamental distinction between `environmental migrants` and `environmental refugees` is a standpoint of contemporsry studies in EDPs.
According to Bogumil Terminski it seems reasonable to distinguish the general category of environmental migrants from the more specific (subordinate to it) category of environmental refugees.
Environmental migrants, therefore, are persons making a short-lived, cyclical, or longerterm change of residence, of a voluntary or forced character, due to specific environmental factors. Environmental refugees form a specific type of environmental migrant.
Environmental refugees, therefore, are persons compelled to spontaneous, short-lived, cyclical, or longer-term changes of residence due to sudden or gradually worsening changes in environmental factors important to their living, which may be of either a short-term or an irreversible character.
According to Norman Myers environmental refugees are “people who can no longer gain a secure livelihood in their homelands because of drought, soil erosion, desertification, deforestation and other environmental problems, together with associated problems of population pressures and profound poverty”.